AI 101
What is Linear Regression?
What is Linear Regression?
Linear regression is an algorithm used to predict, or visualize, a relationship between two different features/variables. In linear regression tasks, there are two kinds of variables being examined: the dependent variable and the independent variable. The independent variable is the variable that stands by itself, not impacted by the other variable. As the independent variable is adjusted, the levels of the dependent variable will fluctuate. The dependent variable is the variable that is being studied, and it is what the regression model solves for/attempts to predict. In linear regression tasks, every observation/instance is comprised of both the dependent variable value and the independent variable value.
That was a quick explanation of linear regression, but let’s make sure we come to a better understanding of linear regression by looking at an example of it and examining the formula that it uses.
Understanding Linear Regression
Assume that we have a dataset covering hard-drive sizes and the cost of those hard drives.
Let’s suppose that the dataset we have is comprised of two different features: the amount of memory and cost. The more memory we purchase for a computer, the more the cost of the purchase goes up. If we plotted out the individual data points on a scatter plot, we might get a graph that looks something like this:

The exact memory-to-cost ratio might vary between manufacturers and models of hard drive, but in general, the trend of the data is one that starts in the bottom left (where hard drives are both cheaper and have smaller capacity) and moves to the upper right (where the drives are more expensive and have higher capacity).
If we had the amount of memory on the X-axis and the cost on the Y-axis, a line capturing the relationship between the X and Y variables would start in the lower-left corner and run to the upper right.

The function of a regression model is to determine a linear function between the X and Y variables that best describes the relationship between the two variables. In linear regression, it’s assumed that Y can be calculated from some combination of the input variables. The relationship between the input variables (X) and the target variables (Y) can be portrayed by drawing a line through the points in the graph. The line represents the function that best describes the relationship between X and Y (for example, for every time X increases by 3, Y increases by 2). The goal is to find an optimal “regression line”, or the line/function that best fits the data.
Lines are typically represented by the equation: Y = m*X + b. X refers to the dependent variable while Y is the independent variable. Meanwhile, m is the slope of the line, as defined by the “rise” over the “run”. Machine learning practitioners represent the famous slope-line equation a little differently, using this equation instead:
y(x) = w0 + w1 * x
In the above equation, y is the target variable while “w” is the model’s parameters and the input is “x”. So the equation is read as: “The function that gives Y, depending on X, is equal to the parameters of the model multiplied by the features”. The parameters of the model are adjusted during training to get the best-fit regression line.
Multiple Linear Regression

Photo: Cbaf via Wikimedia Commons, Public Domain (https://commons.wikimedia.org/wiki/File:2d_multiple_linear_regression.gif)
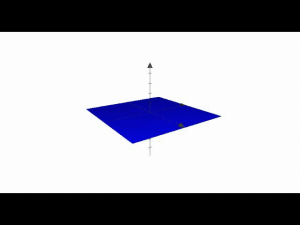
The process described above applies to simple linear regression, or regression on datasets where there is only a single feature/independent variable. However, a regression can also be done with multiple features. In the case of “multiple linear regression”, the equation is extended by the number of variables found within the dataset. In other words, while the equation for regular linear regression is y(x) = w0 + w1 * x, the equation for multiple linear regression would be y(x) = w0 + w1x1 plus the weights and inputs for the various features. If we represent the total number of weights and features as w(n)x(n), then we could represent the formula like this:
y(x) = w0 + w1x1 + w2x2 + … + w(n)x(n)
After establishing the formula for linear regression, the machine learning model will use different values for the weights, drawing different lines of fit. Remember that the goal is to find the line that best fits the data in order to determine which of the possible weight combinations (and therefore which possible line) best fits the data and explains the relationship between the variables.
A cost function is used to measure how close the assumed Y values are to the actual Y values when given a particular weight value. The cost function for linear regression is mean squared error, which just takes the average (squared) error between the predicted value and the true value for all of the various data points in the dataset. The cost function is used to calculate a cost, which captures the difference between the predicted target value and the true target value. If the fit line is far from the data points, the cost will be higher, while the cost will become smaller the closer the line gets to capturing the true relationships between variables. The weights of the model are then adjusted until the weight configuration that produces the smallest amount of error is found.


