Surveillance
Determining the Extent of Video Surveillance Through Google Street View Data
Google Street View’s continuous coverage of the world’s thoroughfares represents possibly the most complete, consistent and coherent visual record of global society, with the exception of countries that impose bans on the search giant’s roving data-gathering vehicles.
As a revenue-delivering contributor to Google Maps’ infrastructure, the Google Street View panopticon is a rich data seam for machine learning analysis. Besides its propensity to unwittingly capture criminal acts, it has been used to estimate regional income from car quality in Google Street View images, evaluate greenery in urban environments, identify utility poles, classify buildings and estimate the demographic make-up of US neighborhoods, among many other initiatives.
Limited Statistics On Surveillance Camera Diffusion In The United States
Despite wide usage of Google Maps’ data for socially aware machine learning initiatives, there are very few Street View-based datasets that include labeled examples of surveillance cameras. The Mapillary Vistas dataset is among the small number available that offer this functionality, though it includes less than 20 labeled public video cameras in the United States.
Much of the video surveillance infrastructure in the US only intersects the State when authorities demand corroborating footage after local incidents that may have been recorded. Beyond zoning regulations, and in the context of permissive privacy laws that do little to address private surveillance of public spaces, there is no federal administrative framework that can provide hard statistics on the number of public-facing cameras in the US.
Anecdotal data and limited surveys contend that video camera diffusion in the US may be on a par with China, but it’s not easy to prove.
Identifying Video Cameras In Google Street View Images
Considering this shortfall in available data, researchers from Stanford University have conducted a study into the prevalence, frequency and distribution of the public-facing video cameras that can be identified in Google Street View images.
The researchers created a camera detection framework that evaluated 1.6 million Google Street View images across 10 major US cities, and six other major cities in Asia and Europe.

In descending order of camera density, Boston tops out the list of US cities examined in the research, with a recent or current density of 0.63 and a total number of cameras at 1,600. Despite this, New York City has far more cameras (10,100) dispersed over a greater area. Source: https://arxiv.org/pdf/2105.01764.pdf
Of US cities, Boston was found to have the highest density of identified cameras, while New York City has the highest number of cameras at 10,100, spread over a larger distance. In Asia, Tokyo has a massive 21,700 estimated cameras, but Seoul has a smaller number of cameras (13,900) concentrated far more densely. Though 13,000 cameras were identified for Street View images of London, Paris beats this both in terms of identified placements (13,00) and density of coverage.
The researchers observe that camera density varies widely between the neighborhoods and zones of the cities.

Among other limiting factors for the accuracy of the survey (which we’ll come to), the researchers observe that cameras in residential areas are three times more difficult to identify than those placed in public parks, industrial areas and mixed-use zones – presumably because the ‘deterrent’ effect is increasingly objectionable or controversial in residential zones, making camouflaged or discreet placements more likely.

Taking into consideration the cities studied in Europe and Asia, Seoul has pole place as the most surveilled urban environment, with Paris not far behind.

Where a zone has a census-defined majority of ethnic or minority residents, the frequency of camera placements spikes notably, even with all mitigating factors taken into account by the Stanford researchers.

Surveillance camera frequency rises in direct proportion to increased minority demographics in a neighborhood, according to the Stanford research.
The research was conducted across two time periods, 2011–2015 and 2016–2020. Though the data shows consistent and sometimes aberrant growth of surveillance camera placement over the nine-year period, the researchers suggest this proliferation of surveillance cameras may have reached a ‘temporary plateau’.
Methodology
The researchers initially compiled two datasets of the Street View images, one of which did not feature video camera placements, and generated segmentation masks for these. A segmentation model was trained on these datasets against a validation dataset (of San Francisco – see ‘Limiting Factors’ below).
Then the output model was run against random Street View images, with all positive camera detections confirmed by humans, and false positives removed.

Left, the raw image from Google Street View. Next, the adapted segmentation mask. Third, an algorithmically-derived camera identification. Right, a human-verified placement.
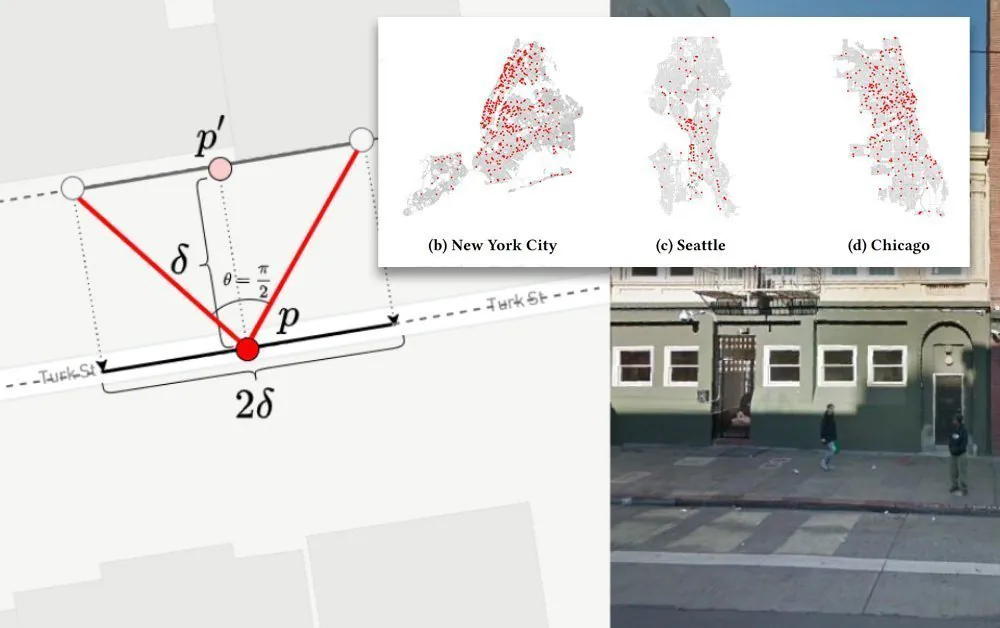
Lastly, the framework calculated the field-of-view of the camera angles involved in order to estimate the extent of coverage, collated against the footprints of the buildings involved and the specifications of the road network.

Other contributing data for this matrix included building specifications from OpenStreetMap, and the use of US census maps to ensure that the study was restricted to the administrative bounds of each city. Additionally, the project used San Francisco camera location data from a study by the Electronic Frontier Foundation (EFF), with the Google Street View images accessed via the Static API.

The researchers estimated coverage by calculating the field of view of the Google Street View cameras against data from OpenStreetMap.
Limiting Factors
The researchers concede a number of limiting factors that should be considered when reviewing the results.
Firstly, that the cameras identified by the machine learning system were all subsequently verified or negated by human review, and that this review is a fallible process.
Secondly, the study was limited by the available resolution of the Street View images, which restricted the researchers to identifying cameras placed within thirty meters of POV. This not only means that some cameras may have been ‘invented’ through limited resolution, but also that many outside of this purview (such as high level cameras, obscured placements and micro-cameras in doorbell fittings) are likely not to have been identified.
Finally, estimating city-specific model recall can be a limiting factor in the accuracy of the results, since the city of San Francisco, where surveillance camera frequency had already been labeled in prior work from the EFF, was applied to other jurisdictions to make the study feasible.


