AI Fundamentals
What is Data Science?

 Add Unite.AI to your preferred sources on Google

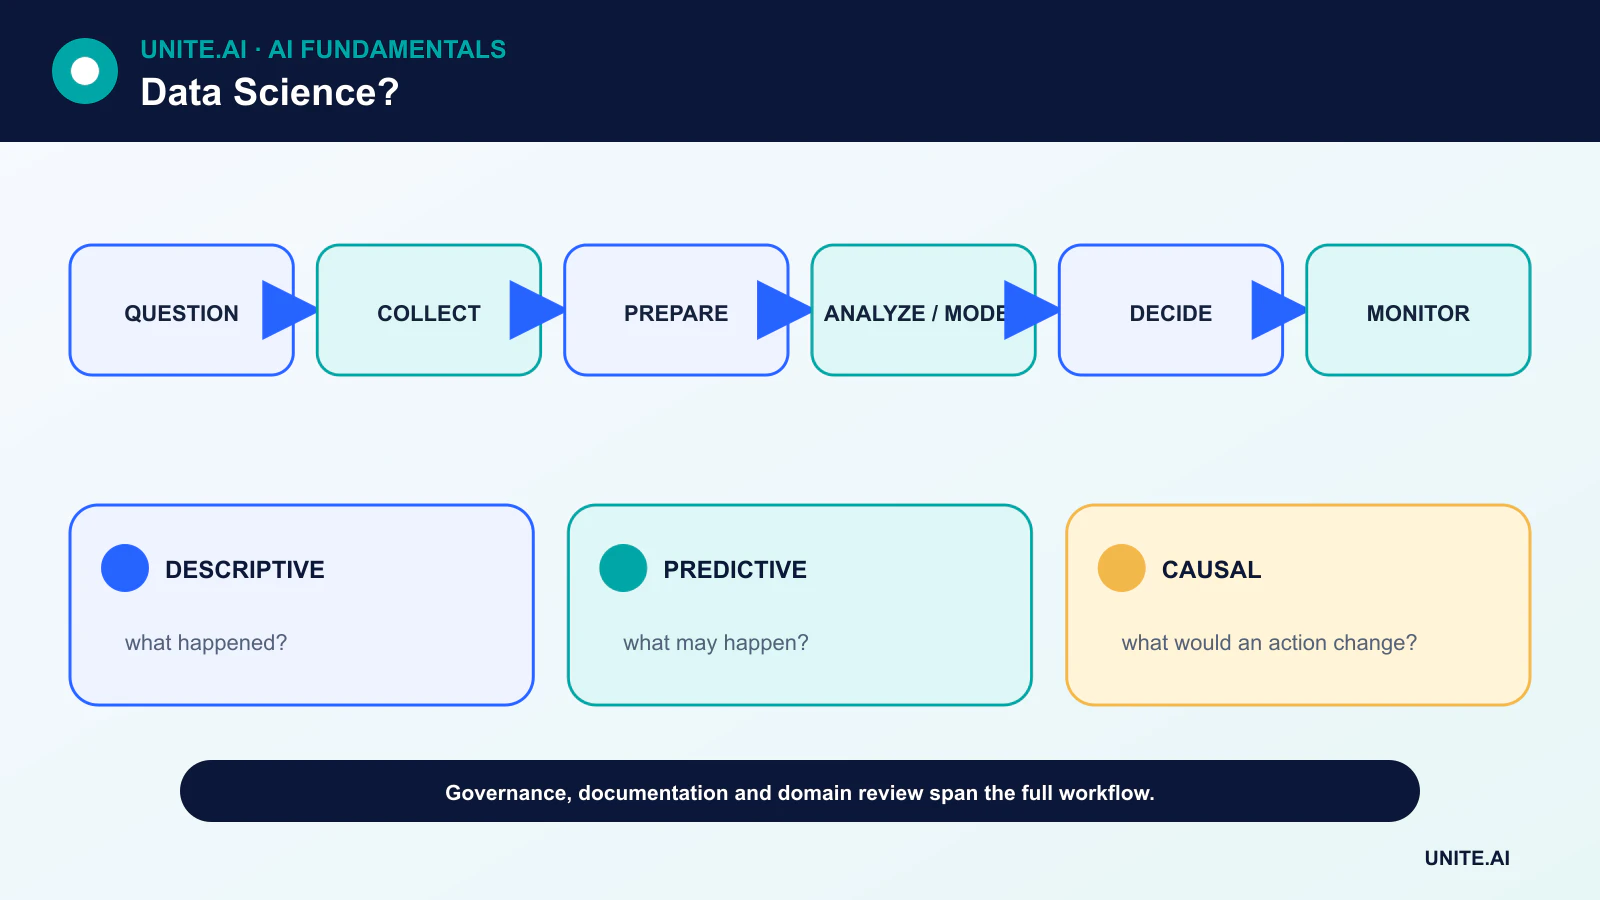
Data science is the practice of turning data into defensible knowledge, predictions or decisions. It combines domain expertise, statistics, computing, data engineering, visualization and communication. A model may be part of the work, but the discipline begins before modeling and continues after deployment.
The most important question is not “Which algorithm should we use?” It is “What decision are we supporting, what evidence would answer it, and how will we know the result remains useful?”
Key takeaways
- Data science is an end-to-end evidence workflow, not a synonym for machine learning.
- Problem definition, measurement and data governance often determine success more than model complexity.
- Predictive and causal questions require different assumptions and evaluation designs.
- A deployed analysis needs monitoring, documentation and communication appropriate to its users.
Start with a decision and an estimand
A project should identify the user, decision, intervention and cost of error. For a descriptive question, the target may be a rate or trend. For prediction, it may be future demand or risk. For a causal question, the estimand describes the effect of a defined intervention under stated assumptions.
Vague goals such as “find insights” make evaluation impossible. A measurable objective creates a boundary for data collection and prevents the analysis from expanding into every available field.
Collect, govern and understand data
Teams inventory sources, ownership, consent, retention, lineage and access. They distinguish structured and unstructured data, define units and timestamps, and examine whether records represent the population and time period of interest.
Cleaning is not just deleting missing rows. It includes resolving duplicates, impossible values, label ambiguity, schema drift, censoring and joins that change the unit of analysis. Every transformation should be reproducible and documented.
Explore before modeling
Exploratory analysis studies distributions, missingness, relationships and potential measurement artifacts. Visualization can expose outliers and subgroup differences that a summary average hides. Exploration should inform hypotheses without being mistaken for confirmatory evidence.
Feature engineering, dimensionality reduction and representation learning may improve modeling, but transforms must be fitted only on training data to prevent leakage.
Choose methods for the question
Statistical estimation quantifies uncertainty around quantities of interest. Machine learning is useful when the primary goal is predictive performance on new data. Experiments and causal inference methods are required when the goal is an intervention effect.
A baseline should be simple enough to understand. More complex models must earn their added cost through better held-out performance, calibrated uncertainty, operational value or a necessary capability such as image or language processing.
Evaluate, communicate and monitor
Evaluation should match the decision. A classifier may require precision, recall, calibration and subgroup analysis rather than accuracy alone; a forecasting system needs time-aware backtesting. Overfitting and leakage are process failures, not just model properties.
Communication includes assumptions, uncertainty, limitations and recommended actions. Once a model or dashboard is used, teams monitor input quality, outcome drift, user behavior and downstream impact. A retired decision process needs an archive and clear ownership just as a deployed one needs an operator.
The data-science lifecycle and analytical questions
Data science combines domain knowledge, statistics, computing, and communication to turn data into evidence for decisions. Begin by distinguishing description, diagnosis, prediction, and causal inference. A dashboard that reports what happened, a model that predicts who will churn, and an experiment that estimates whether an intervention changes churn answer different questions. Define the unit, population, time window, outcome, action, and cost of errors before extracting data. Many failed projects solve a measurable proxy that cannot support the intended decision.
Acquisition requires provenance, permissions, sampling design, and a data contract. Exploration checks distributions, missingness, duplicates, outliers, relationships, measurement changes, and potential leakage. Cleaning choices are analytical assumptions: deleting missing rows, imputing values, or capping outliers can change the population and conclusion. Version raw data immutably and transformations as code, and create a data dictionary with units and meaning. Split evaluation data before learning transformations or repeatedly testing hypotheses.
Modeling, inference, and reproducibility
Statistical inference quantifies uncertainty under assumptions; predictive modeling estimates out-of-sample performance; causal analysis requires identification through design or defensible assumptions. Select methods that match the question and data-generating process. Compare with simple baselines, use grouped or time-aware validation, and report uncertainty and sensitivity. A high correlation or feature importance does not establish causality. Multiple testing, researcher degrees of freedom, and selective reporting can manufacture convincing patterns, so preregistration or a clearly separated confirmatory stage can help.
Reproducibility includes code, environment, data snapshot, random seeds, query definitions, and a record of manual decisions. Automated tests should cover schemas, business invariants, transformations, and metrics. Notebooks are valuable for exploration but production work needs modular, reviewable pipelines. Peer review should challenge assumptions, leakage, target validity, and whether results generalize. Communicate effect sizes, uncertainty, limitations, and counterevidence rather than only statistical significance or a model score.
Deployment and decision impact
If analysis drives a recurring process, assign owners, monitor data freshness and outcome quality, and define rollback or retirement. Protect personal and confidential information through minimization, access control, retention, and safe outputs. Evaluate subgroup effects and how users respond to the model; feedback loops can change future data. Measure whether the decision improved the real objective, not merely whether a model was deployed. Data science is successful when evidence changes action reliably and transparently—not when an organization accumulates dashboards, features, or experiments without ownership.
Worked example: measuring a retention intervention
A product team observes lower retention and defines an active user, cohort, window, exclusions, and decision. Analysts audit instrumentation, missing events, and acquisition mix before modeling. Descriptive cohorts identify where decline occurs, a predictive model prioritizes research participants, and a randomized onboarding experiment estimates whether the proposed change improves retention. These are three distinct analyses with separate assumptions and outputs.
The notebook, queries, data snapshot, metric definition, and experiment plan are versioned and peer reviewed. Results report effect size and uncertainty with guardrails for support demand and accessibility. A dashboard monitors the experiment but does not substitute for the predeclared analysis. If the intervention succeeds, rollout remains staged and checks longer-term behavior. The work is considered valuable only if it supports a reproducible decision, not because a complex model or visually compelling chart was produced.
Implementation evidence and operational readiness
A production decision needs more than a successful demonstration. Define the intended users, operating environment, inputs, outputs, dependencies, owner, and the consequence of each important failure. Establish a reproducible baseline and a versioned evaluation set before tuning. Test ordinary cases, boundary conditions, malformed or missing input, distribution shift, dependency outage, misuse, and the groups or environments most likely to be underserved. Measure task quality together with calibration or uncertainty, latency, throughput, resource cost, accessibility, privacy, and security. Record every transformation and threshold so an independent reviewer can reproduce the result and distinguish evidence from an attractive prototype.
Before launch, assign authority for release, exceptions, changes, rollback, and retirement. Use a staged rollout, preserve a safe fallback, and verify monitoring with deliberately injected failures. Operational telemetry should reveal input quality, output behavior, model or rule version, dependency health, human overrides, and confirmed outcomes without collecting unnecessary sensitive data. Define alert thresholds and a response owner, then review real-world evidence after deployment rather than assuming offline performance will persist. Reevaluate whenever data sources, users, models, vendors, policies, hardware, or objectives change. A maintained system also needs documented recovery, incident learning, deletion and retention procedures, and a clear point at which it should be disabled or replaced.
Frequently asked questions
Is data science the same as data analytics?
The terms overlap. Data science often includes building data products and predictive systems, while analytics may focus more on descriptive and diagnostic decision support. Organizational usage varies.
Does every data-science project need AI?
No. A well-designed query, chart, experiment or statistical estimate can be more useful and trustworthy than a complex model.
Primary references