AI Fundamentals
Measuring and Reducing AI’s Carbon Footprint with CodeCarbon

 Add Unite.AI to your preferred sources on Google
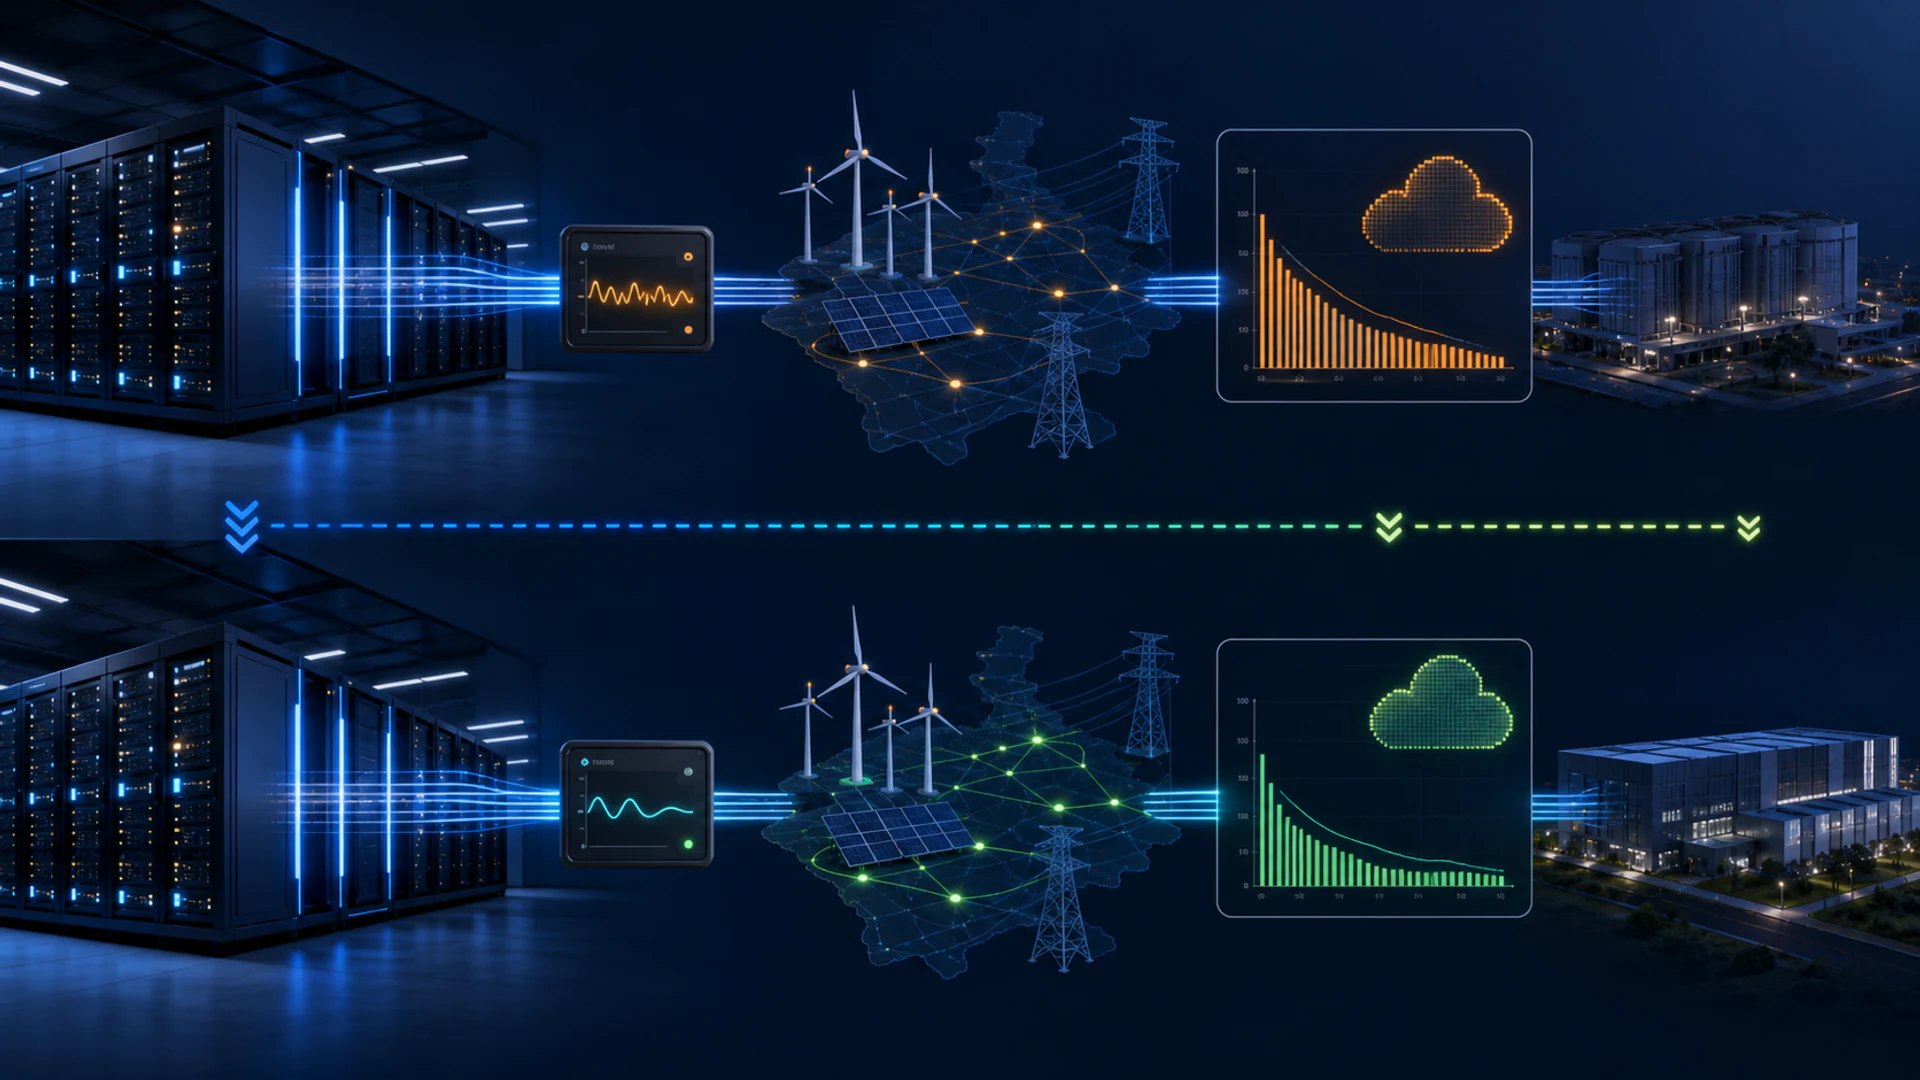
AI workloads consume electricity, and the greenhouse-gas emissions associated with that electricity depend on where and when computation runs. CodeCarbon is an open-source tool that estimates operational emissions by combining workload energy estimates with electricity carbon intensity.
An estimate is useful when its boundary and uncertainty are explicit. It does not automatically include manufacturing hardware, building data centers, networking, storage or the downstream effects of deploying a model.
Key takeaways
- Energy use and carbon emissions are related but not identical; grid carbon intensity varies by region and time.
- CodeCarbon estimates CPU, GPU and memory energy, then applies location-dependent emissions factors.
- Hardware utilization, run duration, data-center overhead and measurement source affect accuracy.
- The practical goal is comparable reporting and reduction, not false precision.
Energy, power and carbon intensity
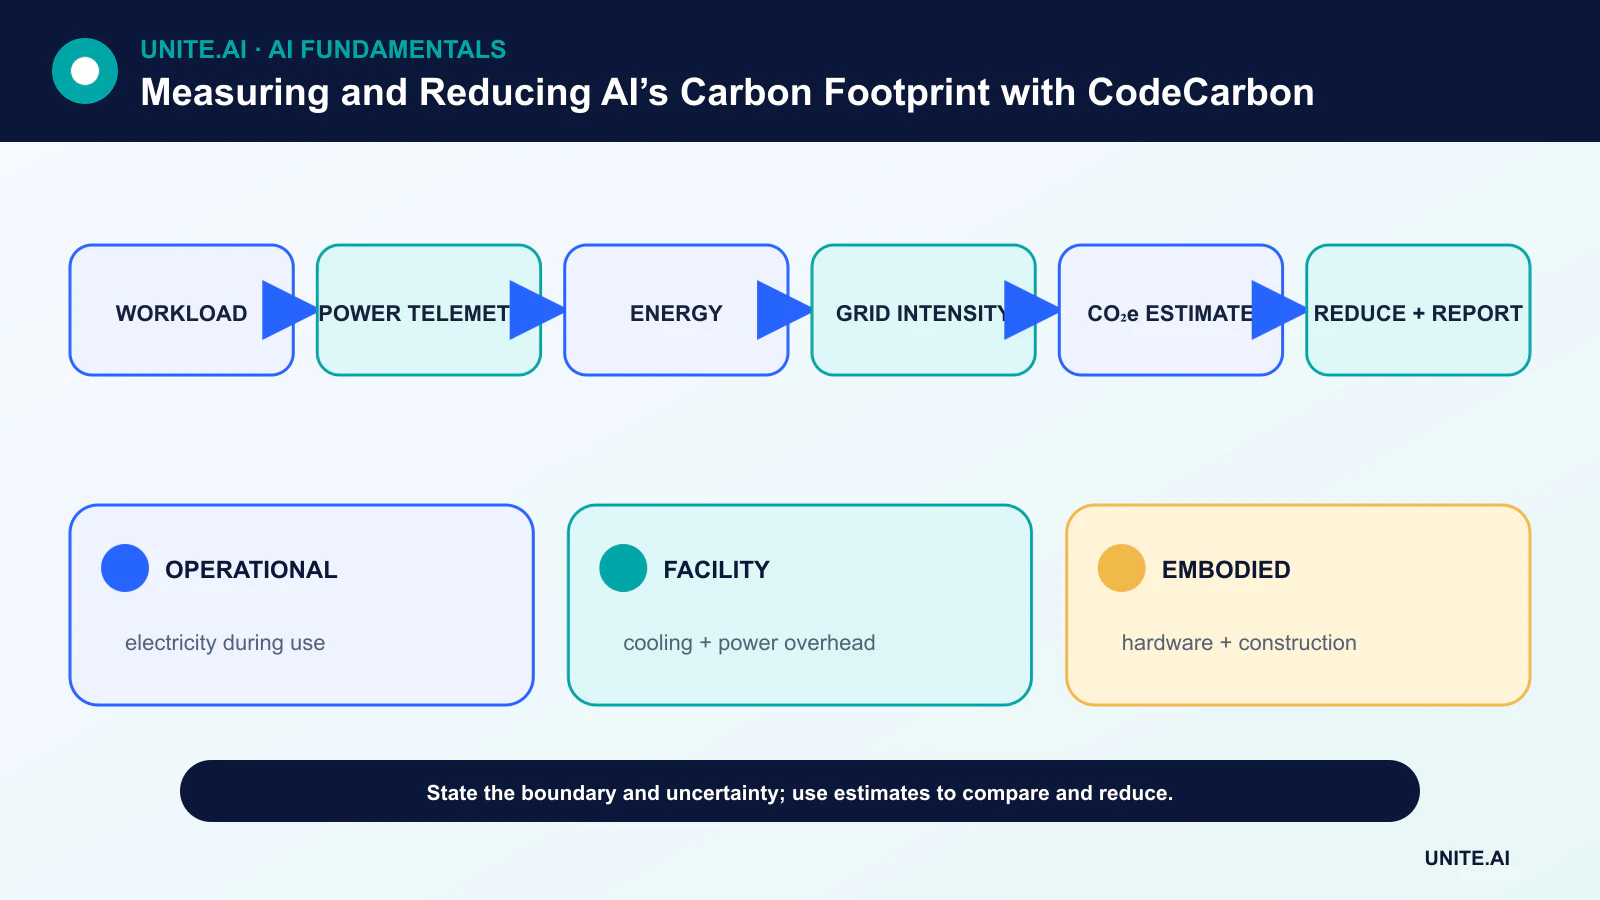
Power is the rate of energy use, commonly measured in watts. Energy accumulates over time, commonly in kilowatt-hours. Operational carbon dioxide equivalent is estimated by multiplying energy by an emissions factor such as grams of CO₂e per kilowatt-hour.
The same job can have different emissions when run on a cleaner grid or at a lower-carbon time. A faster accelerator may use more instantaneous power yet less total energy if it finishes much sooner.
What CodeCarbon measures
CodeCarbon observes or estimates energy for compute components and records metadata such as duration and location. When hardware exposes direct power telemetry, estimates can be more specific; otherwise the tool uses hardware models and utilization assumptions.
Online mode can use location-aware carbon intensity, while offline settings rely on configured factors. The output is an estimate whose method, software version and configuration should be retained with the experiment.
Choose a reporting boundary
A run-level boundary may cover one training job. A project boundary may include hyperparameter search, failed runs, preprocessing and inference. A service boundary may include networking, storage and continuous deployment.
Data-center power usage effectiveness accounts for facility overhead beyond IT equipment. Embodied emissions from manufacturing and construction require lifecycle data that a runtime tracker usually does not provide. Reports should state exclusions instead of blending incomparable totals.
Reduce before offsetting
Start with the value of the workload: remove redundant experiments, use early stopping, reuse checkpoints and select efficient baselines. Improve utilization, batch appropriately and match model size to the task. Transfer learning can avoid training from scratch.
Schedule flexible work in lower-carbon regions or times where lawful and operationally practical. Compress models and choose efficient serving hardware; edge AI may reduce data transfer but can also duplicate underused hardware, so measure the full system.
Report uncertainty and compare fairly
Publish hardware, location, runtime, energy, emissions factor, number of runs and whether the value is measured or estimated. Separate exploratory compute from the final training run. Avoid reporting many decimal places when assumptions dominate precision.
Compare systems at the same task quality and boundary. A low-energy model that fails the task is not efficient, while a small accuracy gain may not justify a large resource increase. Carbon is one impact alongside cost, water, hardware lifecycle and social benefit.
What CodeCarbon estimates
CodeCarbon estimates energy use and carbon emissions associated with a computation. Depending on environment and available telemetry, it may read CPU, GPU, RAM, or system power, integrate energy over time, and multiply by a carbon-intensity estimate for the electricity region. Results are estimates shaped by hardware coverage, sampling interval, process attribution, power models, location, and grid data. They should include units, version, methodology, and uncertainty rather than be reported as exact physical measurements.
Operational emissions come from electricity during training and inference; embodied emissions come from manufacturing, transport, and disposal of hardware and are usually outside a runtime tracker. Shared servers complicate allocation, while cloud instances may expose limited telemetry. Average grid intensity differs from marginal intensity and changes by time. Renewable contracts and offsets are accounting instruments, not proof that a workload caused zero emissions. State the boundary clearly before comparing runs or providers.
Designing a meaningful measurement experiment
Track task, model, data, hardware, region, duration, utilization, energy, carbon estimate, quality, and number of successful outputs. Warm-up and cache effects can distort short runs, so repeat measurements under controlled load. Compare models at equal quality and service objectives rather than one training epoch or token count. Include data preparation, hyperparameter search, failed experiments, idle resources, and recurring inference where material. A smaller training footprint can be overwhelmed by high-volume serving.
Use the tool to find engineering levers: reduce unnecessary runs, use early stopping, right-size accelerators, improve utilization and batching, select efficient models, quantize or distill, cache results, schedule flexible work in lower-carbon periods or regions, and retire idle resources. Every optimization must preserve required accuracy, latency, safety, and reliability. Moving computation without considering data transfer or regional constraints can shift rather than reduce impact.
Reporting and governance
Publish methodology, software version, hardware, geographic assumption, quality metric, and uncertainty alongside the estimate. Avoid comparing organizations that use different boundaries. Set budgets and review large experiments before they run, but do not reward teams for hiding compute outside measured environments. Secure experiment metadata and avoid logging private prompts or data. CodeCarbon makes environmental cost visible and comparable within a disciplined method; it cannot provide a complete lifecycle assessment or replace independently verified energy and carbon accounting.
Worked example: comparing two model-training runs
A team trains the same image model on two accelerator types and uses CodeCarbon with identical data, quality target, batch logic, and stopping rule. It records tool version, hardware, region, sampling, utilization, duration, energy, carbon-intensity source, and uncertainty. The comparison includes failed trials and preprocessing, while embodied hardware emissions are explicitly outside the runtime estimate. Results are normalized per quality-qualified training run.
The more efficient configuration is then tested for inference latency, reliability, and downstream accuracy. Engineers reduce idle time and hyperparameter runs, improve batching, and schedule flexible work where grid intensity is lower without moving regulated data. A report publishes assumptions and avoids claiming zero impact from renewable contracts. The estimate becomes a budget and design signal, not a marketing badge. Repeated measurement checks whether optimization reduced total lifecycle workload rather than one visible run.
Implementation evidence and operational readiness
A production decision needs more than a successful demonstration. Define the intended users, operating environment, inputs, outputs, dependencies, owner, and the consequence of each important failure. Establish a reproducible baseline and a versioned evaluation set before tuning. Test ordinary cases, boundary conditions, malformed or missing input, distribution shift, dependency outage, misuse, and the groups or environments most likely to be underserved. Measure task quality together with calibration or uncertainty, latency, throughput, resource cost, accessibility, privacy, and security. Record every transformation and threshold so an independent reviewer can reproduce the result and distinguish evidence from an attractive prototype.
Before launch, assign authority for release, exceptions, changes, rollback, and retirement. Use a staged rollout, preserve a safe fallback, and verify monitoring with deliberately injected failures. Operational telemetry should reveal input quality, output behavior, model or rule version, dependency health, human overrides, and confirmed outcomes without collecting unnecessary sensitive data. Define alert thresholds and a response owner, then review real-world evidence after deployment rather than assuming offline performance will persist. Reevaluate whenever data sources, users, models, vendors, policies, hardware, or objectives change. A maintained system also needs documented recovery, incident learning, deletion and retention procedures, and a clear point at which it should be disabled or replaced.
Frequently asked questions
Does CodeCarbon directly measure CO₂ coming from a computer?
No. It estimates emissions from energy use and electricity carbon intensity; computers do not directly emit the grid’s greenhouse gases.
Is cloud computing always lower carbon?
No. Results depend on hardware efficiency, utilization, data-center overhead, grid mix, region, time and data movement.
Primary references